


The web uses HTML for structure, CSS for styling and JS for functionality. When displaying data the same rules apply — we should use HTML to store the data, CSS to style the structural HTML elements, and JS to provide functionality.
Yet charting libraries skip this fundamental idea in pursuit of releasing pretty charts over accessibility.
Browsers like screen-readers, that rely on HTML semantics, often struggle to interpret JS charts leaving the information inside unavailable to the visitor. Accessibility issues were fixed with further JavaScript solutions, but this has further knock-on effects for the webpage performance.
Perhaps you’ve even noticed yourself how slow charting libraries can be for a typical browsing experience, even with just a pie chart.
Maybe there is a better way to solve accessibility and performance, by coming back to basics.
Charts.CSS
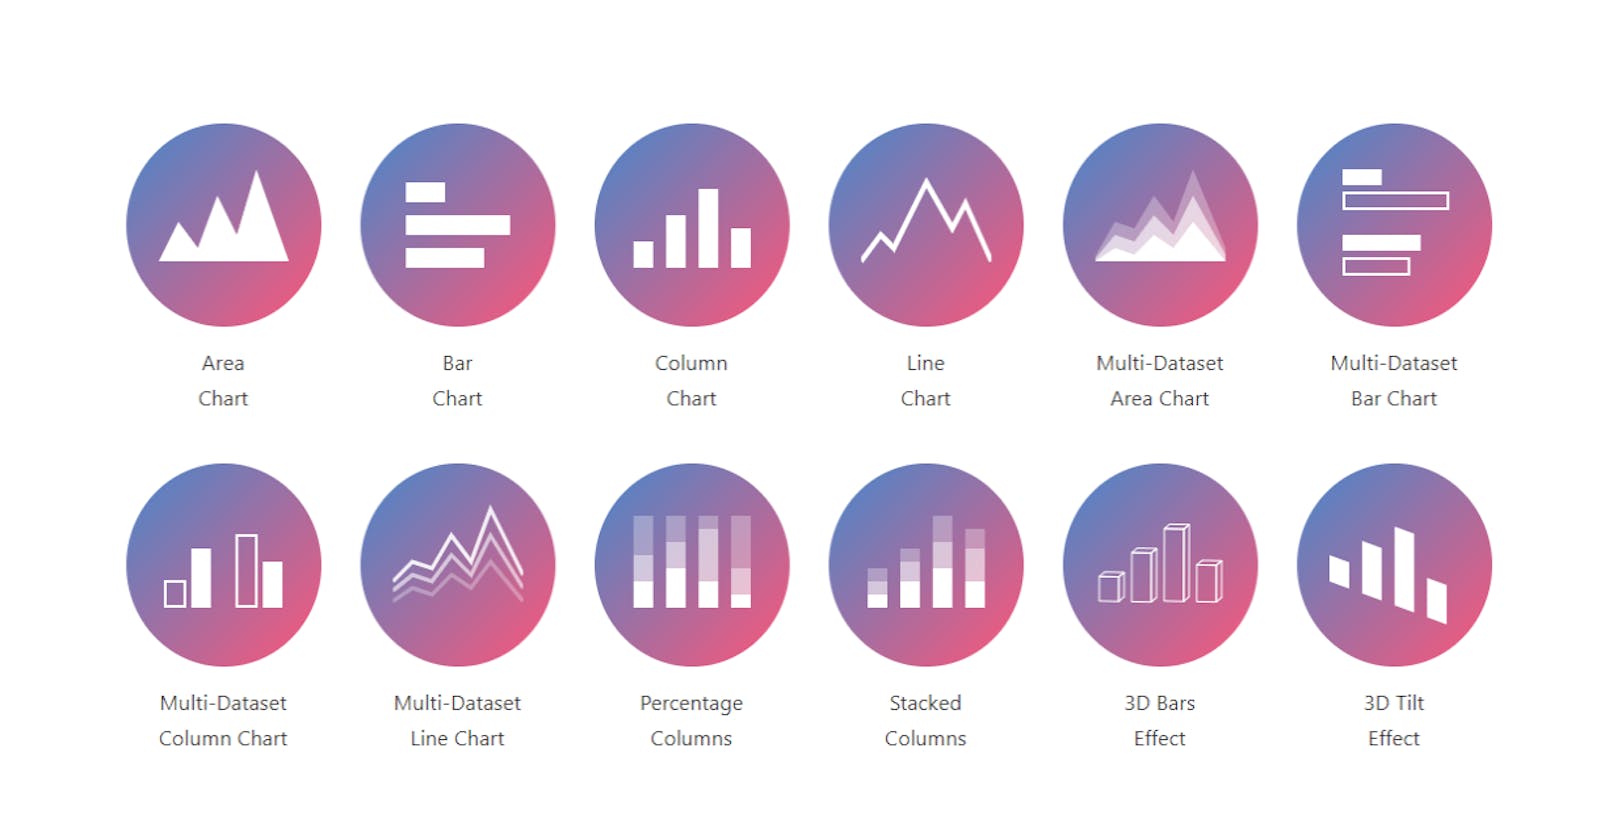
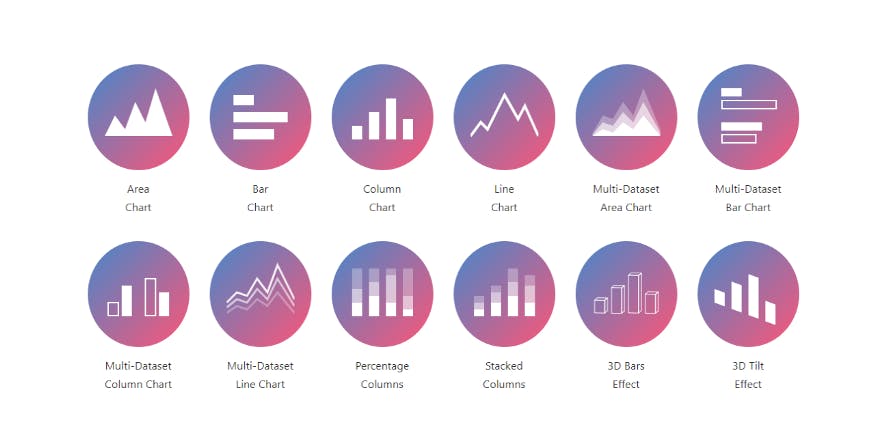
Charts.css is a modern CSS only framework , that uses atomic/utility CSS classes to style HTML elements as charts.
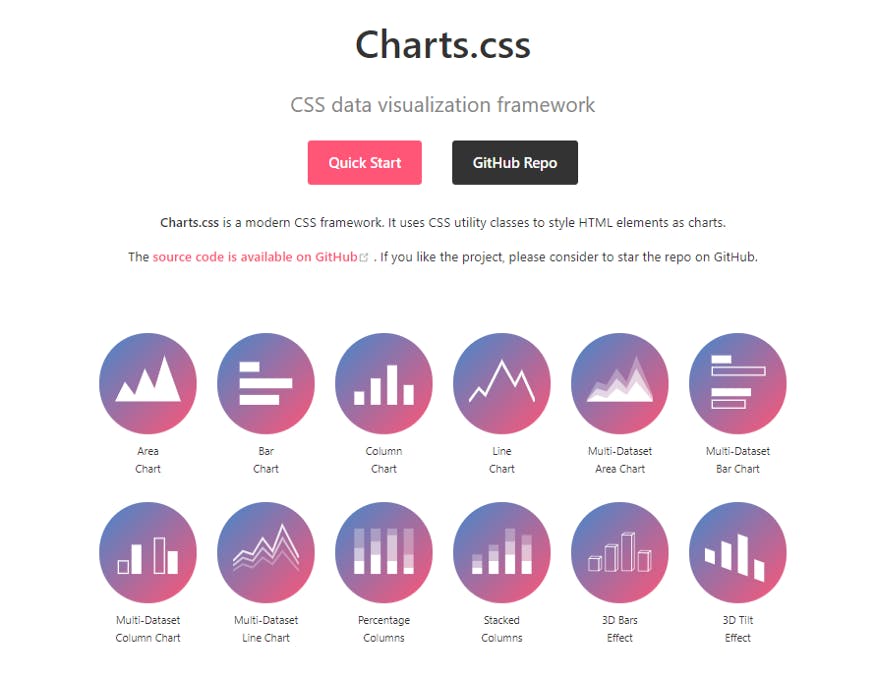
Raw data is placed in the document as a semantic HTML <table> tag, making it visible to search engines and screen readers.
- Completely customisable
- Responsive
- Accessible, by doing something novel: rendering the data inside semantic HTML tables that browsers can read
- Small library, only 72kb
- Incredible performance due to no JS
The value this framework brings to those who require cutting-edge performance with the additional win of premium accessibility compared to alternative frameworks , Charts.CSS is a serious new player on the block.
You probably don’t need JavaScript
If your end product displays static data or the data is non-interactive, then you simply do not need JavaScript.
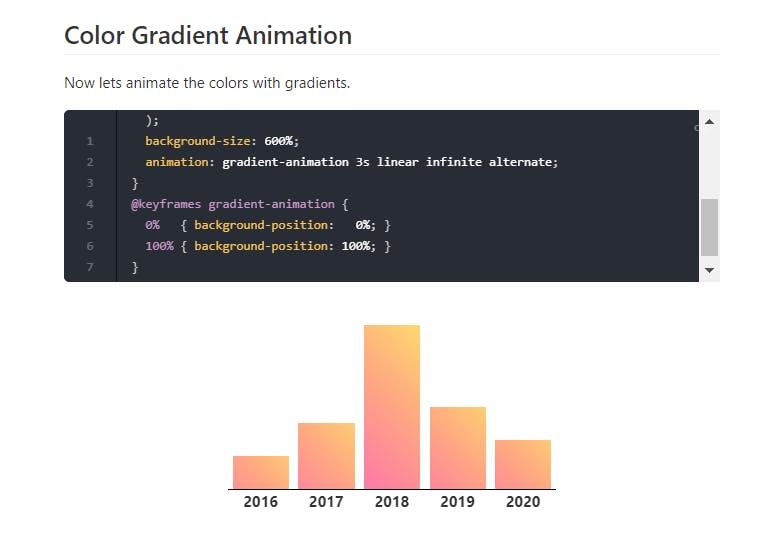
CSS can offer you 60 FPS animations with significant control that requires no JS.
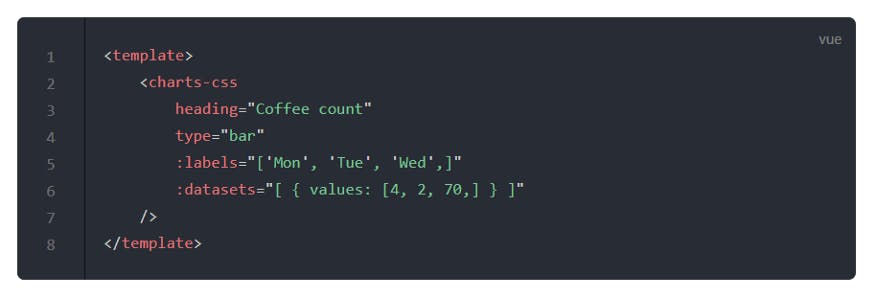
But you need an interactive chart? Let me introduce Vue Charts JS
That’s ok, sometimes you do need JavaScript!

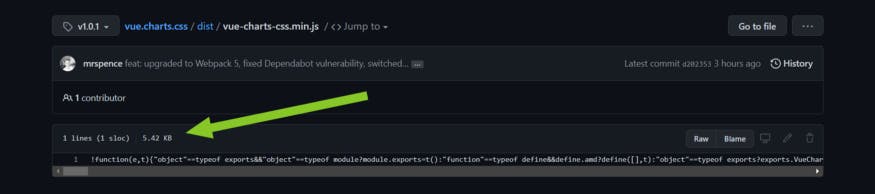
There is a community maintained Vue JS wrapper called Vue Charts CSS too, weighing in at only 5.42kb. Compressed and minified to fit on just one tiny line.
This wrapper does the heavy lifting and allows you to use the power of Vue JS to provide interactive charts, powered by Charts CSS. All you have to do is pass it the data.
Should I switch?
Potentially! But read this first.
I’m currently the main contributor to Vue Charts CSS, so I’m 110% biased.
That said, I’m also regularly advising clients and product owners and can give you two pros and cons that I would consider first.
Either way, do explore Charts CSS and learn how it works.
Pro: Unparalleled performance and accessibility benefits.
Con: bear in mind that the author of Charts CSS is planning to release guides to better styling the charts, but at this point there is a weight on your shoulders here and perhaps not suitable for newer developers.
Con: The underlying framework is relatively new and has more features and charts to be built. You may find that some abilities you have with JS charts don’t yet exist. The author is planning to extend the project out, but this may not add up to your requirements. Check the docs first!
Pro: If you need interactivity, give Vue Charts CSS a look. Or, if you prefer a different technology like React, then perhaps be the first to build and maintain the wrapper.
Of course, feedback is always welcome and if you’d like to play with the concept, then please drop by Charts CSS and/or Vue Charts CSS!
- Charts CSS (framework)
- Vue Charts CSS (wrapper)
Maintaining Open Source projects is hard work, please do drop a GitHub star on these projects if you appreciate their direction!